
Renewables Momentum, Policy Risk and Data‑Centre Demand – Australia
Australia’s electricity market is large and rapidly changing. In 2024 the National Electricity Market (NEM) generated about 284 TWh of electricity, with renewable energy supplying roughly 36 % of the total. Wind and solar output has grown quickly over the past five years—wind generation doubled and solar output surged so that solar became the second‑largest source of power. Renewables now constitute 61 % of installed capacity and provided 40 % of electricity in 2024. Official projections call for 82 % renewable generation by 2030, but current growth rates imply this share may not be reached until around 2040 unless build rates accelerate. Despite the politicisation of climate policy, renewable energy is increasingly driven by economics, corporate procurement and structural demand such as data centres. Large‑scale solar and wind are now the cheapest new‑build technologies even after accounting for integration costs. The weighted‑average cost of capital (WACC) for utility‑scale solar and onshore wind projects is about 7–7.5 %, whereas gas and coal projects face WACCs of 9–12 %. Investment is robust: new financial commitments for large‑scale generation jumped from $1.5 billion in 2023 to $9 billion in 2024, while 81 generation projects (∼13 GW) and 75 storage projects (∼13 GW/34.7 GWh) are currently committed or under construction. Corporate power‑purchase agreements (PPAs) have contracted about 7.7 GW of renewable capacity and provide revenue certainty for developers.
The emergence of hyperscale data centres is a major wildcard. Data centres currently consume roughly 4 TWh of electricity—about 2 % of demand—but bottom‑up analysis suggests operational capacity will grow to 2.2–3.2 GW by 2035, consuming 24–35 TWh and representing 8–11 % of national electricity use. Serving this demand without additional renewables could lift wholesale prices by 26 % in New South Wales and 23 % in Victoria. Modelling shows that an extra 3.2 GW of wind and solar and 1.9 GW of battery storage would mitigate most of the price impact. Renewable‑energy zones (REZs) and committed transmission projects across states such as New South Wales, Queensland and Victoria lock in billions of dollars of infrastructure. The NSW program alone expects at least 12 GW of new generation by 2030 and has attracted 408 projects totalling 135 GW of capacity; more than 3,000 km of new transmission lines are planned. Queensland’s roadmap proposes 12 REZs able to connect about 22 GW of new renewable capacity and at least 6 GW of long‑duration storage, while Victoria’s transmission plan models 14 GW of additional wind and solar and 9 GW of offshore wind by 2040.
Taken together, these dynamics mean that even a sharp reversal of federal policy is unlikely to derail the structural transition. Economics now favour renewables; capital is being deployed based on commercial returns; and emergent loads such as data centres, industrial decarbonisation and electrification will continue to drive demand. Policy still matters for timing and sentiment, but the trajectory towards a renewable‑dominated system appears economically irreversible.
The Size of the Prize: Australia’s Energy Market Today
Australia’s electricity market is both sizeable and undergoing rapid transformation. In calendar 2024 the NEM produced about 283,920 GWh (284 TWh) of electricity. The generation mix has shifted significantly over the past decade (Table 1). Black coal remains the largest single source (34% of generation), but solar PV now ranks second, producing 51,849 GWh (18.3%). Wind contributed 32,894 GWh (11.6%), hydro 5%, and bioenergy 1.2%. Overall, renewables supplied 36.1% of electricity in 2024 and 40% when rooftop PV is included. Installed capacity tells an even more striking story: about 61% of NEM capacity is now renewable, with 3.98 GW of utility‑scale renewable generation added in FY2024—a 15% increase—and 3.2 GW of rooftop PV installed in 2024.
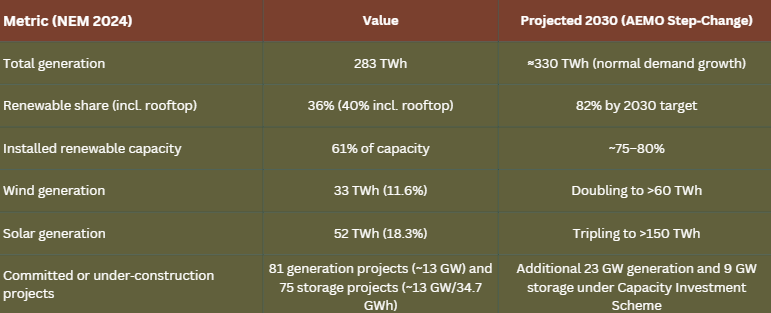
Table 1 – Generation mix and projections
Growth has been driven by technology learning curves and domestic uptake. Wind generation has roughly doubled in five years, while solar PV has become the fastest‑growing generation source, with rooftop installations alone exceeding 25 GW. AEMO’s forecasts assume “normal” demand growth—that is, incremental electrification of households and industry without surging data‑centre or hydrogen loads. Under these assumptions, AEMO’s Step‑Change scenario targets 82% renewables by 2030, yet modelling by Net Zero Australia suggests that at recent build rates (adding about 3 % of supply per year), the 82% threshold would not be reached until around 2040. Meeting the 2030 goal therefore requires doubling annual renewable additions and accelerating transmission.
The Economics Have Shifted
Cost competitiveness
Large‑scale solar and wind are now unequivocally the cheapest sources of new electricity in Australia. The GenCost 2024‑25 study shows that, even after including integration costs of $48–64/MWh in 2024 falling to $23–40/MWh by 2030, solar and onshore wind remain the lowest‑cost technologies. The same report notes that gas with carbon capture, solar thermal and nuclear are all higher‑cost options. Globally, solar module prices have fallen by around 90% and onshore wind by 70% over the last decade; battery costs have fallen even faster. CSIRO’s GenCost update indicates large‑scale solar capital costs fell 8% in 2024 and battery costs fell 20%, reversing pandemic‑driven increases. These declines mean variable renewables can profitably underbid coal and gas even without subsidies.
Financing environment and WACC
Financing conditions favour renewables. Oxford Economics’ 2024 discount‑rate report prepared for AEMO estimates the real, pre‑tax WACC for utility‑scale solar at 7.0%, onshore wind at 7.5%, and large‑scale batteries at 8.0%. By contrast, gas‑fired open‑cycle plants face a WACC of 9% and combined‑cycle gas plants 10.5%, while new coal generation is estimated at 12%. Higher WACCs reflect greater technology, fuel‑price and policy risk for fossil assets. The lower cost of capital for renewables is underpinned by cheaper finance, strong investor appetite and maturing technology.
Capital flows have been resilient despite policy uncertainty. Clean Energy Council data show that new financial commitments for large‑scale generation leapt 500% in 2024, from $1.5 billion in 2023 to $9 billion, the largest wave of investment since 2018. Commitments were supported by the federal Capacity Investment Scheme, which will underwrite 23 GW of generation and 9 GW of storage projects to 2030. The Clean Energy Council’s Q4 2025 investment report recorded five renewable generation projects (1.2 GW) and five storage projects (1.1 GW) reaching financial close in the quarter, with total capital investment exceeding $4 billion. Nine generation projects totalling 2.1 GW were commissioned in that quarter alone. The forward pipeline comprises 81 generation projects (nearly 13 GW) and 75 storage projects (13 GW/34.7 GWh) either financially committed or under construction, plus significant pumped hydro (13.5 GW/496 GWh) projects under development.
Corporate procurement and private capital
Corporate PPAs have been instrumental in moving projects to financial close. As of December 2023 there were 172 publicly confirmed PPAs in Australia, contracting around 7.7 GW of renewable generation and supporting roughly 15 GW of project capacity. The Business Renewables Centre reports that corporate PPAs now account for nearly one‑fifth of new renewable project capacity, providing price certainty and long‑term revenue that reduces financing risk. Offtakers include tech companies, miners, universities and supermarkets. This demand is unlikely to vanish with a change in federal policy; cost savings and ESG commitments make renewables attractive regardless of subsidies.
The Data‑Centre Wildcard
Australia’s digital economy is propelling a new source of demand: hyperscale and AI‑centric data centres. Existing data centres consumed about 3.9–4 TWh of electricity in FY2025 (roughly 2% of total demand). Baringa’s bottom‑up forecast for the Clean Energy Finance Corporation projects that rated capacity will grow by 4.7 GW under a central case and 7.4 GW under a high case by 2035, resulting in 2.2–3.2 GW of operational capacity. This equates to 24–35 TWh of annual consumption—8–11% of projected electricity demand—up from about 1% today. Most new facilities will cluster around Sydney and Melbourne, with roughly half of pipeline projects located in Sydney alone.
AEMO’s current demand forecasts assume modest growth in data‑centre loads; there is a risk they could be underestimated, particularly if AI adoption accelerates. The Baringa report models four scenarios. If data‑centre demand materialises without additional renewable build, wholesale prices could rise by 26% in NSW and 23 in Victoria by 2035, driven by increased reliance on gas peakers. To mitigate most of this impact, Baringa estimates that an extra 3.2 GW of renewable capacity and 1.9 GW of battery storage beyond baseline builds will be needed. Using typical capacity factors from AEMO’s 2024 Integrated System Plan (wind 28%, solar 21%), 3.2 GW of renewables would produce roughly 7.5 TWh per year—enough to supply a 10% uplift in projected data‑centre consumption. Put another way, each additional 1 GW of firm demand would require about 1.5 GW of new wind projects (equivalent to five 300‑MW wind farms) or 2.5 GW of solar projects (roughly eight 300‑MW solar farms) plus associated storage to maintain system reliability.
The data‑centre boom also tightens the program and supply‑chain risk for project delivery. Developers must plan for long lead‑times, high‑voltage connection queues and constrained construction resources. Procurement strategies may need to prioritise firm supply agreements and early contractor involvement, as large data‑centre developers seek renewable PPAs and co‑located batteries to secure their own supply. For investors, this demand represents an opportunity to diversify revenue streams through behind‑the‑meter generation, virtual PPAs and hybrid projects.
Renewable Energy Zones: Policy as Infrastructure, Not Incentive
The transition is underpinned by massive infrastructure programs that embed renewables into the grid. New South Wales is developing five REZs (Central‑West Orana, New England, South‑West, Hunter‑Central Coast and Illawarra) with a collective target of at least 12 GW of new generation by 2030. The state’s registration of interest process attracted 408 generation and storage projects totalling 135 GW of capacity and 190 GWh of storage potential. To connect these projects, NSW plans more than 3,000 km of new high‑voltage transmission lines, including Central‑West Orana (180 km, due 2027), Hunter transmission (150 km, due 2027), New England (400 km, due 2028) and national interconnectors such as Project Energy Connect (680 km, due 2025) and HumeLink (360 km, due 2029). These are multi‑billion‑dollar investments with 40‑year asset lives. Once built, reversing course would strand sunk capital and create reliability risks.
Queensland’s Renewable Energy Zone Roadmap (2024) identifies 12 potential REZs capable of connecting around 22 GW of new grid‑scale renewables and requiring at least 6 GW of long‑duration storage to firm generation. The state has legislated renewable energy targets of 50% by 2030 and 70% by 2032 and is developing pumped hydro projects such as Borumba (2 GW/48 GWh).
Victoria’s 2025 Transmission Plan models six REZs (Central Highlands, Central North, Gippsland, North West, South West and Western) and expects 1.5 GW of existing wind/solar capacity, 2.5 GW of committed projects and up to 14.2 GW of additional wind and solar plus 9 GW of offshore wind by 2040. Transmission builds such as the VNI West interconnector and offshore wind hubs are underway.
These REZs provide more than policy signals; they are structural commitments to new grid architecture. They entrench renewable resources geographically and economically, create long‑dated network access rights and allocate transmission cost recovery over decades. Abandoning them would be commercially irrational because existing contracts, regulatory determinations and investor expectations are built around high renewable penetrations.
Industry‑led proposals and the inland REZ push
Beyond government‑led REZ programs, a group of developers is seeking to accelerate the build‑out by proposing additional renewable‑energy zones in remote areas. Energy News Bulletin reported in February 2026 that a consortium of six companies – Tilt Renewables, Squadron Energy, Iberdrola, Acciona Energía, Ark Energy and Voyager Renewables – lodged a submission to AEMO’s draft 2026 Integrated System Plan (ISP) calling for an “Inland Renewable Energy Region” in far north‑west and western New South Wales. The consortium argues that existing REZs are constrained by social‑licence, land‑use and hosting‑capacity limitations and that offshore wind faces high costs and long lead times. By targeting sparsely populated outback areas with abundant wind and solar resources, the proposal seeks to unlock more than 10 GW of new renewable generation at full scale, with an initial stage of 2‑4 GW by 2035 and 6 GW by 2040. The project would require a new high‑capacity inland transmission link with multiple HVAC or HVDC configurations; potential connection points under investigation include Broken Hill, Mt Piper, Bannaby and Wollar. Proponents emphasise that this additional zone is not part of the federal government’s 82% by 2030 target but would help meet expected demand growth from data centres, electrification and industrial loads. Renew Economy also notes that the inland REZ could ultimately exceed 10 GW and that a memorandum of understanding has been signed to assess a new transmission link to the Cobar region.
The inland REZ proposal illustrates how industry is pushing renewable expansion beyond existing plans. It mirrors Transgrid’s 2024 Transmission Annual Planning Report, which identified remote REZs around Broken Hill, Noona and the north‑west as having some of the best solar‑wind resource correlations in the NEM and suggested they could diversify NSW’s supply. It also shows how private developers may coordinate to fund and develop transmission corridors when government programs are delayed or contested. By signing a memorandum of understanding to jointly assess a new transmission link to the Cobar region, the consortium has signalled a willingness to underwrite early development work and de‑risk the project before seeking regulatory approval. Should such industry‑led REZs proceed, they would reinforce the structural inertia created by transmission investments and broaden the geographic distribution of renewable assets.
Can Politics Really Reverse This?
The evidence suggests that even a sharp federal policy reversal would not materially change the long‑term trajectory of Australia’s renewable transition. Several factors underpin this view:
Cost advantage is durable. Solar and wind, backed by storage, remain the cheapest sources of new electricity. High fossil‑fuel prices and the global collapse of module costs reinforce this advantage. Even if federal incentives were withdrawn, the WACC for renewables (≈7%) is substantially lower than for gas and coal (9–12%), ensuring competitive project economics.
State policies are entrenched. NSW, Queensland, Victoria, South Australia and Western Australia all have legislated renewable targets, REZ programs and transmission projects. States could continue procurement and contracting even without federal schemes. Many REZ investments and long‑term energy service agreements extend well beyond federal election cycles.
Corporate and industrial demand. Large energy users—from miners to supermarkets and tech companies—are locking in renewable PPAs for price stability and ESG commitments. Data‑centre developers are poised to sign multi‑decade agreements with renewable generators and batteries to secure supply. Demand for green hydrogen and green metals drives large‑scale projects such as Intercontinental Energy’s 26‑GW Pilbara renewable‑hydrogen hub, which recently secured government funding.
Infrastructure lock‑in. Billions already committed to transmission and pumped‑hydro projects (13.5 GW/496 GWh of storage) cannot be unwound without major write‑downs. Once new lines and storage assets are in service, the grid’s physical and economic design favours variable renewables.
International parallels. In the United States, state‑level renewable standards and corporate procurement continued to drive build‑out through periods of federal policy uncertainty. Europe’s energy‑security crisis after the invasion of Ukraine underscored the risks of fossil‑fuel dependence and accelerated renewable investment despite political differences. Australia’s exposure to volatile global coal and gas markets makes the cost and supply‑security benefits of renewables compelling.
Nevertheless, policy matters for timing. Reduced federal support could slow tendering processes, increase risk premiums and delay some projects, particularly those relying on the Capacity Investment Scheme. Without coherent national coordination, transmission delivery risks could worsen. However, the direction of travel—towards a predominantly renewable system—appears economically locked in.
What This Means for Investors and Project Delivery
For developers, investors and contractors, the takeaways are practical:
Capital discipline and risk allocation: Although renewables offer attractive returns, program risk is rising. Construction inflation, supply‑chain bottlenecks and labour shortages can erode contingencies. Contracts must allocate price‑escalation risk and provide flexibility for weather‑related delays and grid‑connection slippage.
Programme scheduling: The build‑out required to meet state targets and new data‑centre loads will strain construction capacity. Early procurement of transformers, inverters and high‑voltage equipment is essential. Co‑ordinating generator commissioning with transmission completion reduces stranded‑asset risk.
Revenue certainty: Securing long‑term offtake is critical to obtaining finance at favourable WACCs. Corporate PPAs, capacity‑investment scheme agreements and state long‑term energy service agreements all provide price floors. Hybrid projects combining generation and storage can capture multiple revenue streams (spot arbitrage, FCAS markets, capacity payments).
Transmission and firming: Projects must account for network congestion and curtailment risk. Locating within REZs with firm access rights and incorporating storage or firming (e.g., pumped hydro or batteries) will be increasingly valuable. Data‑centre co‑location may offer opportunities for behind‑the‑meter supply and grid services.
Contingency planning for demand variability: Rapid data‑centre load growth could add several gigawatts of demand. Investors should model scenarios where peak demand exceeds forecasts by 10–20%; this may require additional wind/solar projects and storage. Building optionality into project portfolios—such as expansion rights or modular design—can help manage this uncertainty.
In conclusion, the economic and structural momentum behind renewables in Australia is formidable. While federal policy influences investor confidence and project timing, the combination of low costs, state commitments, corporate demand, transmission lock‑in and emerging data‑centre loads makes the renewable transition economically irreversible. Commercial realism dictates that capital will continue to flow to technologies with lower cost of capital, stable revenues and long‑term growth prospects—and in Australia those are increasingly solar, wind and storage.
How QIA can assist with renewable project feasibility
Quantum Insights Advisory (QIA) is an independent quantity‑surveying and commercial advisory practice. Its services span commercial and contract advice, claims management, carbon planning, project assurance and traditional cost management/quantity surveying. For developers assessing renewable‑energy projects, QIA can provide feasibility‑stage cost planning, procurement strategy and risk‑allocation advice to ensure projects remain commercially viable. The firm’s carbon‑planning services deliver embodied‑carbon assessments and value‑management, helping proponents meet sustainability goals and maximise eligibility for green finance. Through its project‑assurance offering, QIA conducts independent reviews to test budgets, schedules and contingency allowances, enabling investors to better manage programme risk and supply‑chain uncertainty. The company also utilises a hybrid resourcing model that combines a Sydney‑based team with offshore quantity‑surveying capacity, allowing it to scale quickly and support peak‑period demand for cost and carbon advisory services . By integrating cost, carbon and commercial expertise, QIA can help renewable developers produce robust feasibility studies, secure financing and deliver projects on time and within budget.
Data Appendix
Key statistics
Total generation (2024): 283,920 GWh.
Renewables share: 36.1 ; 40% when rooftop PV included.
Installed renewable capacity: 61 of NEM capacity.
New capacity added in 2024: 5.2 GW (3.2 GW rooftop PV, 2 GW utility‑scale).
Large‑scale pipeline (Q4 2025): 81 generation projects (~13 GW) and 75 storage projects (~13 GW/34.7 GWh) committed or under construction.
Corporate PPAs: 172 deals contracting 7.7 GW.
Data‑centre consumption: 3.9–4 TWh in FY2025; forecast 24–35 TWh by 2035.
REZ registrations: NSW ROIs 135 GW of capacity; Queensland plan 22 GW; Victoria plan up to 14.2 GW of new wind/solar.
Pumped hydro pipeline: 13.5 GW/496 GWh of storage capacity in development.
Scenario assumptions
Capacity factors: Wind 28%, solar 21% (AEMO ISP).
Data‑centre high‑case demand: 35 TWh by 2035.
Additional renewable build to meet data‑centre demand: 3.2 GW of new capacity plus 1.9 GW battery storage.